UH IRWGS PANDEMIC GENDER SNAPSHOT #7 – December 22, 2020[2]
The trends continue, in PGS #10 – published Nov. 29, 2021: LINK
Cross-posted from UH IRWGS website: https://uh.edu/class/ws/research/
Tracking Covid-19 fatality data by gender, race/ethnicity and age.
Though vaccines are now being delivered to health workers and the most vulnerable elderly, fatalities continue in Houston/Harris County (H/HC). While we feel optimistic, masking and distancing remain key to getting through what we can hope will be the final phase of the pandemic.
Between October 2 & December 1, 2020, 536 Covid-19 deaths were reported in H/HC, raising the count to 2439 (945 women and 1494 men—61.3%/38.7%).[3] (All data are provisional and do not include undiagnosed Covid-19 deaths, or deaths with certificate not finalized.) The lag time for death certification in this data was roughly two months overall (see appendix). National and local daily mortality reports are based on death certificates, which take time to process, so the reports are always a substantial undercount.
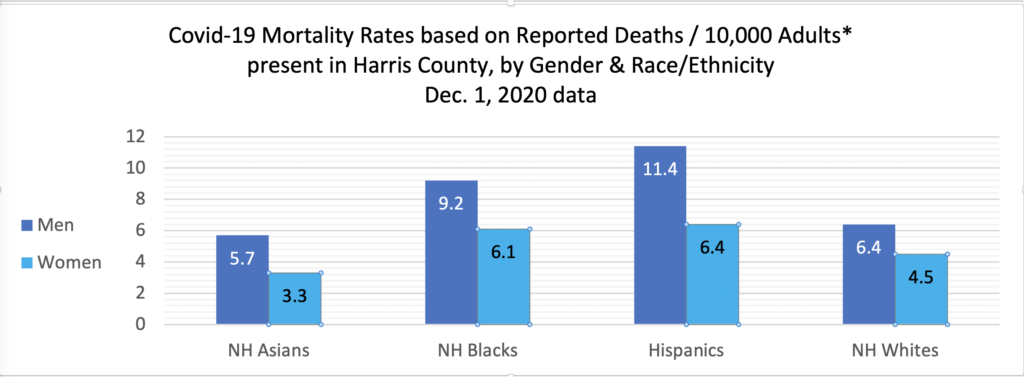
Between the last Snapshot on Oct. 1 data and this report based on Dec. 1 data, the gender, race/ethnicity and age differentials in Covid-19 mortality in H/HC have continued marked. Figure 1 provides a H/HC Covid-19 mortality rate calculation by gender and race/ethnicity based on 2020 reported deaths to date compared to the adult population breakdown of Harris County.[4]
People of color, particularly men of color, have borne the brunt of the losses. Figure 2 presents the specific numbers of reported H/HC Covid-19 deaths by gender, race/ethnicity and age.
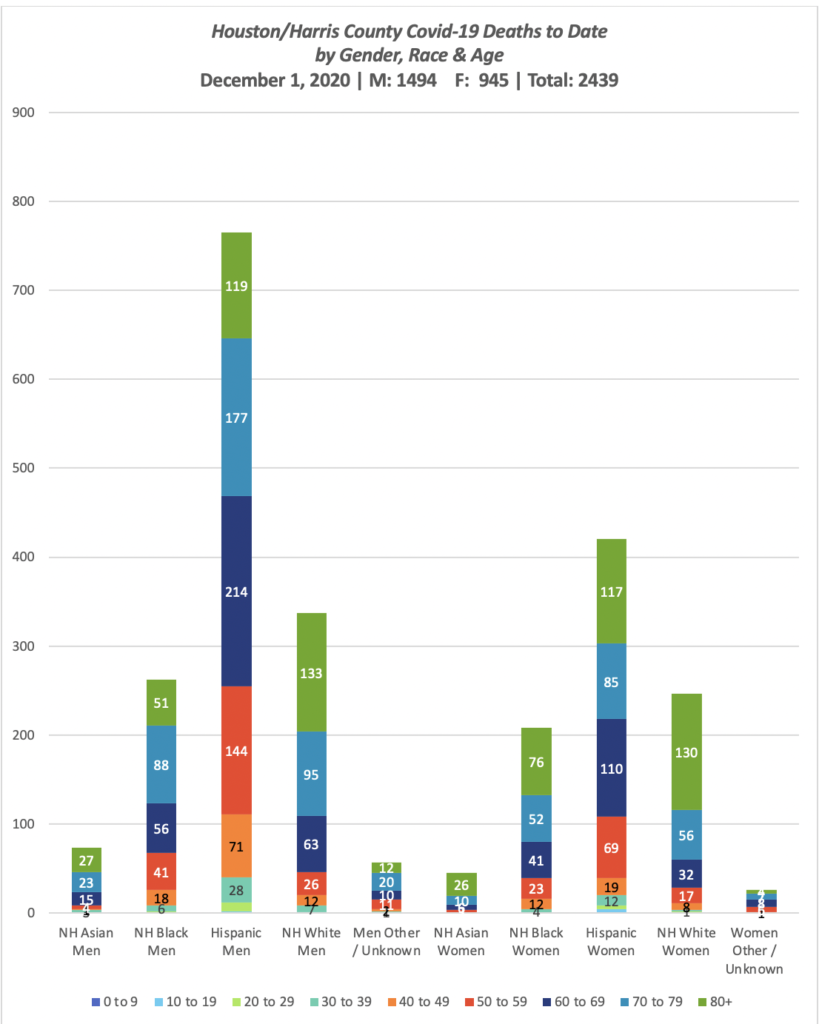
As of Dec. 1, reported deaths by group included: Asian 118 (73m; 45f); Black 470 (262m; 208f); Hispanic 1185 (765m; 420f); White 583 (337m; 246f); Other/Unknown 83 (57m; 26f). The divisions in health revealed here along lines of class and race/ethnicity (often linked in the US) indicate the need for a more equitable state and national health system. One way of addressing this in Texas could begin as early as this Spring 2021 with expanded access to Medicaid through the ACA. Such a system would return tax dollars to Texans that they are already paying (to effectively fund health care in other states), with 90% of costs covered federally. The remaining 10% would be covered by the rise in state tax dollars collected on the new funds brought into the state and spent at Texas businesses. The State Legislature could pass such expansion in the 2021 session.
The adult population of Houston/Harris County (20+) (per ACS 2019) breaks out by Gender & Race/Ethnicity thus:
Male: 7.9% NH Asian; 17.6% NH Black; 41.8% Hispanic; 32.7% NH White
Female: 8.2% NH Asian; 20.5% NH Black; 38.9% Hispanic; 32.4% NH White
Though the documentation of infections does not reliably report race/ethnicity,[5] so we cannot track infection equity or correlate infection with death rates here, death certificates do document race/ethnicity, fairly consistently. (However, Harris County has increasingly listed race/ethnicity as Unknown [7.8% on Sept. 1, 1.6% at mid-July; COH HD R/E Unknown is 0.4%][6] Designations as Unknown Race were found by a Washington PostSpecial Report to more often involve people of color than whites). Figure 3 portrays the adult (20+) Covid-19 mortality rate relative to the presence of each group in the full H/HC population, regardless of gender. Since gender is a major determiner of Covid-19 outcomes, Figure 1 gives a fuller portrait of the effects here.
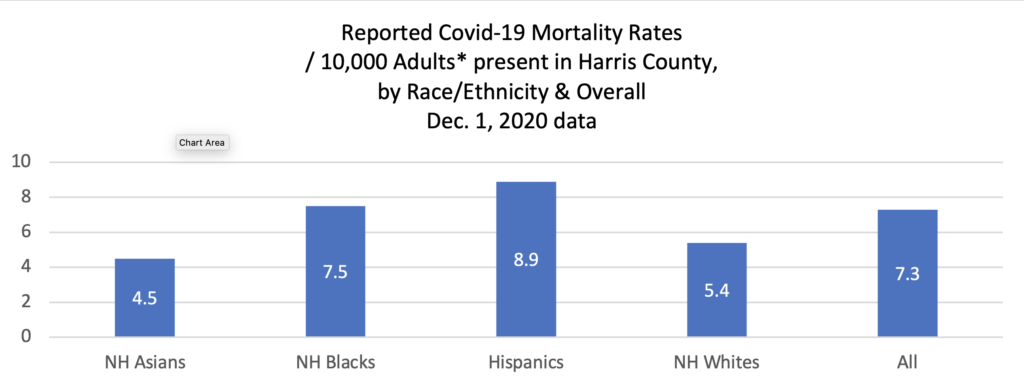
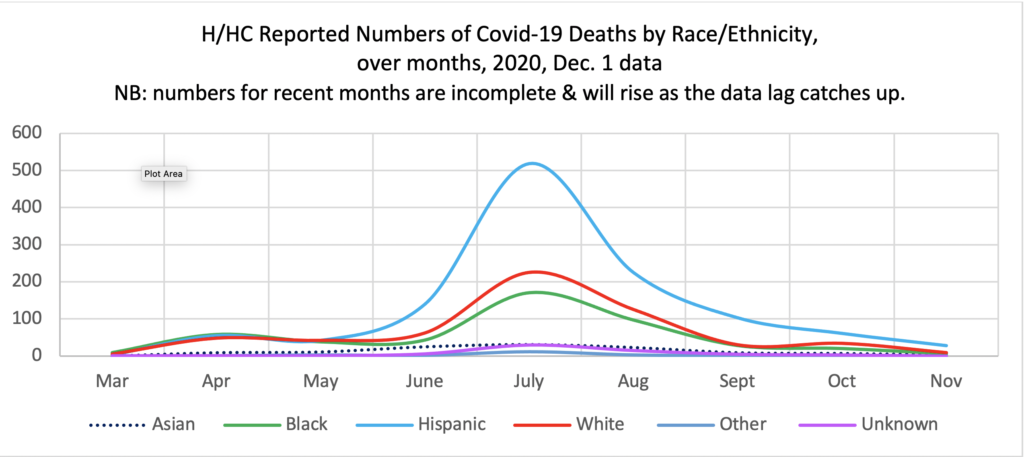
Figure 4 charts the deaths over months by race/ethnicity. The rise in deaths in July (a ripple effect of the May opening) affected all groups, but disproportionately.[7]Though Hispanics make up 40.4% of the adult population, they made up 54.9% of the total Covid-19 deaths in July (as reported to date). Whites comprised 23.8% of the dead, but 32.5% of the population, so they were disproportionately low. Given that the best outcome would be to share low numbers across all groups, there is no “correct number” of deaths for any group. Blacks made up 18.1% of the dead which is roughly parallel to their 19.1% of the population, but If the number of Black deaths were proportionate with the number of White deaths in July (225) they would number 132, instead of the actual 171. Thus, Black deaths are also disproportionately high compared to Whites, and Hispanics are even more so.
RACE/ETHNICITY ANALYSES
Figure 1 indicates that Hispanic men are dying of Covid-19 at a rate 78% higher than that of White men, double that of Asian men, and 24% higher than that of Black men; while Black men have died at a rate more than 44% higher than White men and 61% higher than Asian men, per reports to date.
Differences are in part attributable to the combination of historical bias creating unequal access to health care; doctors when accessed treating people of color less aggressively; which has led historically to higher incidence of underlying conditions. In addition, those with higher rates of frontline employment and dense living situations face elevated infection rates.
As a result of frontline employment, relatively large numbers of young people are included in the Hispanic and Black death tolls, whereas that is not the case among Whites and Asians. Those who can work at home are not as likely to be infected. Where 31.9% of Hispanic and 25.6% of Black male deaths were to men 59 and under, this was true for only 13.7% of White and 10.9% of Asian male deaths. Likewise, where 25.7% of Hispanic and 18.8% of Black female deaths were to women 59 and under, this was true for only 11.4% of White and 6.7% of Asians female deaths. Though younger people (under 65) may be under the impression that they are immune from serious Covid effects, these data indicate that is not the case, and that they should take the same precautions as their elders. In addition, some long term effects of Covid-19 on some who have been infected and recovered, of all ages, including brain damage, are suspected but not yet understood.
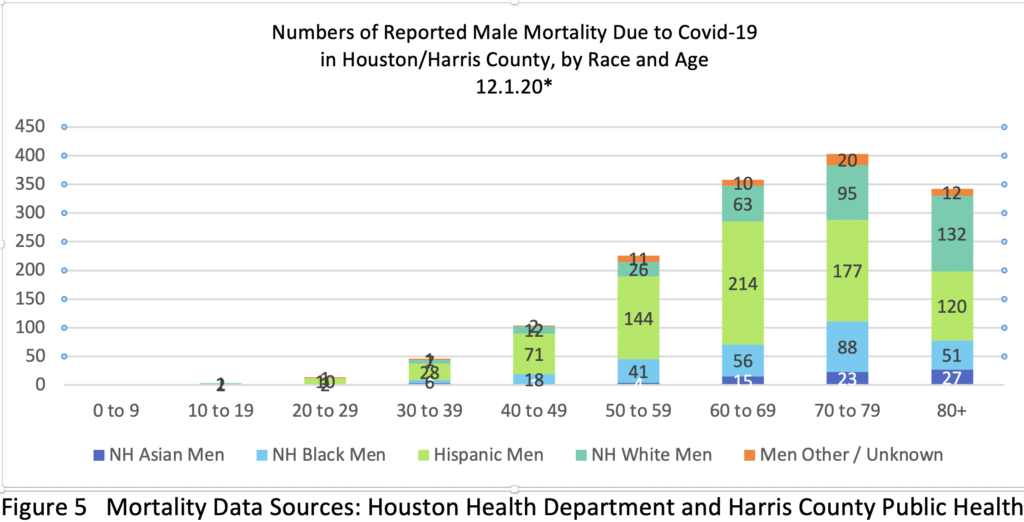
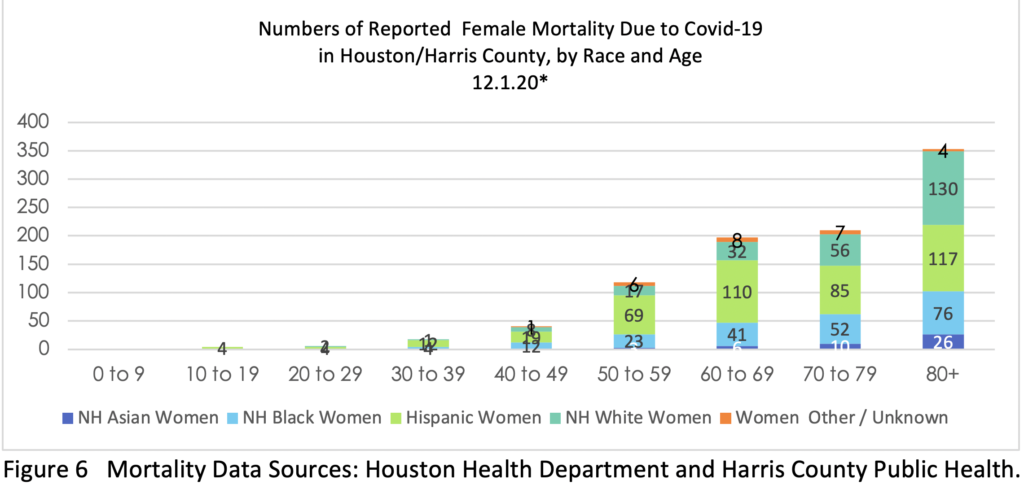
Figure 7 charts mortality rate per thousand based on reported deaths to date by decade per gender and racial/ethnic group – indicating that mortality rates among both Blacks and Hispanics by decade were substantially greater than, often more than double, those of Whites and Asians in all age groups, with some variation by gender.
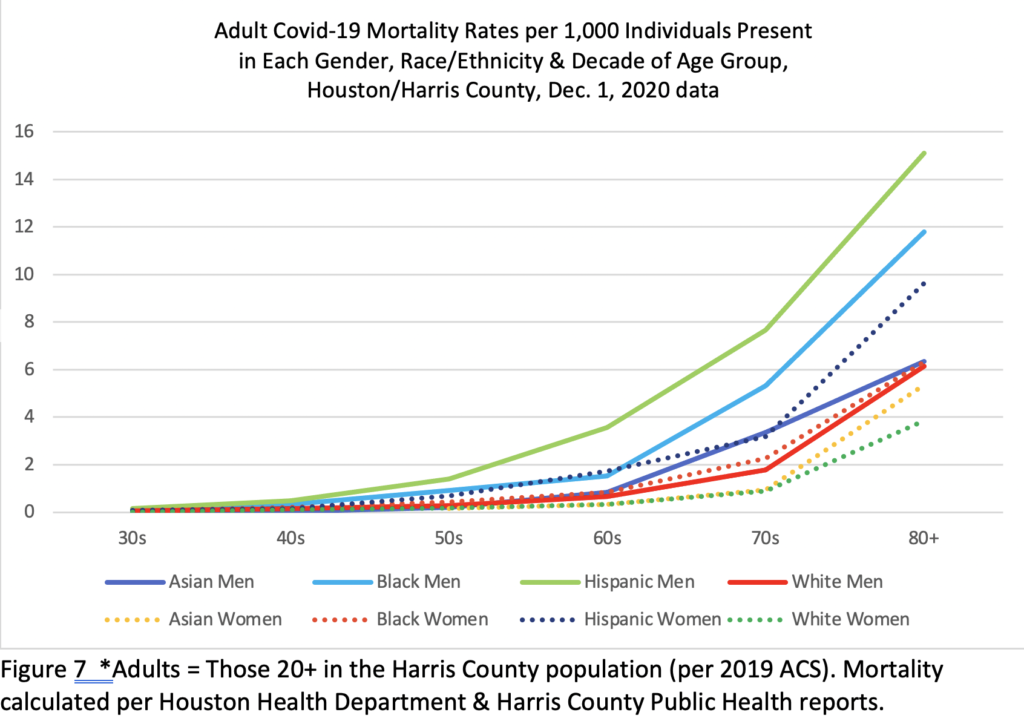
Mortality rates overall are generally higher among men as compared to women but variation among women of different racial/ethnic groups is also substantial and some women’s group rates are close to those of some men’s. While Black and Hispanic women in H/HC have died at rates lower than men of their same groups, their rates are equal to or near par with those of White men and higher than Asian men. Hispanic women have died at rates 42% higher than White women, 94% higher than Asian women, and 5% higher than Black women. Black women have died at rates36% higher than White women and 85% higher than Asian women. Age variation factors in here as well.
There is also a big difference in the gender variation between racial/ethnic groups here: Hispanic Men have died here at a reported rate 78% higher than Hispanic women; Asian men at a rate 73% higher than Asian women; Black men at a rate 51% higher than Black women; and White men at a rate 42% higher than White women. That is a 36% gap between Hispanic and White gender differentials, which may be linked to men (often younger men) being in some frontline jobs in greater numbers than women, to their having limited health care access and/or to those men being in worse health than women and/or taking fewer health precautions.[8]
Along with contagion in frontline jobs, economic repercussions of the pandemic (including evictions) increase the likelihood that people will be packed into shared apartments with no room for sick people to isolate. Immigration fears also impact the Hispanic community as well as other immigrant communities here, relative to deportation and to the Feb. 2020 federal ruling (enacted right before the pandemic) that blocks green card access for those who utilize food stamps and some health and housing assistance. Some may choose to seek no aid, even in illness.
Of the 536 deaths reported between Oct. 2nd and Dec. 1st, 3 occurred in April, 6 in May, 18 in June, 123 in July, 114 in August, 100 in September and 126 in October and 46 in November. All of the 17 “Unknown Race” deaths come from Harris County data. Per death certificates, totalreported Covid-19 deaths in Houston/ Harris County to date per month are: March 18; April 172; May 147; June 278; July 987; August 488; September 177; October 126; November 46. Though July was a period with high mortality and later months have been lower to date, the lag in reporting means the more recent months are as yet incomplete and will rise. The dip in deaths in May reflects the County Judge’s Stay Home order (in effect from March 24, 2020), and the rise thereafter reflects the Governor’s lifting of the order (May 1).
1-WEEK to several-MONTH Lag in COVID Fatality Reports
Though the numbers of new reported Covid-19 infections fell for a time in Houston/ Harris County since highs in June and July, rates are now rising again and the death toll continues to rise. Exact monthly numbers are not yet known, due to a current roughly 2-month lag in reporting due to processing. (See appendix for the spread of recent report dates.) This finding mirrors a recent Houston Chronicle report about the pattern of delay in reporting Covid deaths across Texas.[9] As the report noted, policy decisions based on lagging data may be problematic, at all levels of government, as was the case in May when the state’s low reported death rate was used as evidence for the safety of reopening. The pattern is ongoing and statewide deaths were undercounted at a rate of at least 44% in July, per the Chronicle.
The lag in reporting in Houston/Harris County is displayed in Figure 8, where the dotted lines show the number of deaths by date that had been reported as of Sept. 1, the dashed lines show the reported deaths as of Oct. 1, and the solid lines show the reported deaths as of Dec. 1. On Sept. 1, the most recent reported death had occurred on Aug. 24th – and the total number of Covid deaths were said to number 1334 (see “Total 9.1” line – pink dots). But by Oct. 1, in the line directly above, the number reported dead as of August 24th had risen to 1786, and by Dec. 1st, 2022 deaths had been documented to have occurred as of August 24th (reflected in the solid green line directly above that point)—688 more people than were known to have died on Sept. 1, and still climbing.
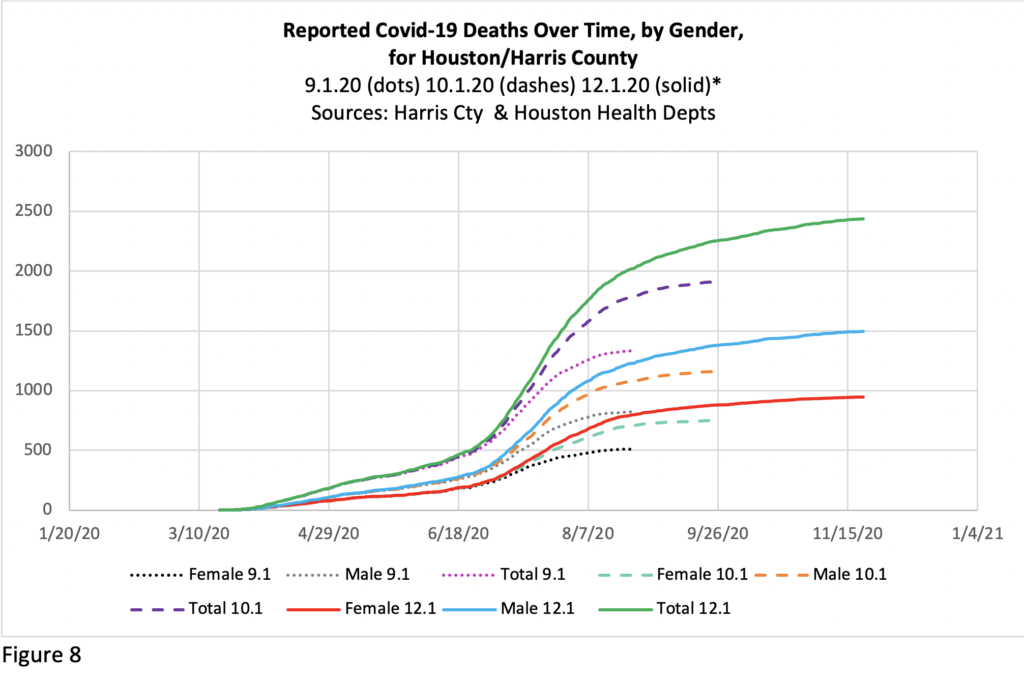
This suggests that current numbers are much behind, and the actual death rates for recent months will not be known for some time, though strides have been made in catching up the summer backlog. The levelling off in the most recent weeks in Figure 8 reflects the lag in reporting – and will shift upward as more data comes in and if deaths increase again as has been predicted for the winter. Keep the lag in mind when you hear reports on the current official fatality rate.
The state data collection systems were not set up for real time reporting, so trying to make policy on the basis of current count information is confusing to everyone. Though similar issues obtain in all jurisdictions, per the Houston Chronicle’s October 2nd report Texas’s data collection system is particularly slow—with “Texas’ gap between the number of people dying and its reported deaths … at least two to three times greater than California or New York’s during their deadliest days.” Data systems are outdated and health agencies are understaffed and underfunded, relative to need; the legislature should address these issues in the Spring session.
Currently the most reliable real-time measure of the pandemic may be hospitalization rate, based on weekly direct reports on ICU bed usage, which is trackable for all Texas counties on the UT School of Public Health Covid-19 Dashboard.[10] As of 12.20.20, 23% of ICU beds in Houston are occupied by Covid-19 patients, while in El Paso it is 49%, and Amarillo 63%. When Excess Deaths are analyzed next year (see below), the numbers of deaths recognized to be Covid-19 linked will rise further, across all months of the pandemic. All these dynamic data changes will also impact gender, race and age analyses, so this report and others based on current data are provisional.
GENDER ANALYSES
Of the total 2439 reported deaths in the two jurisdictions to Dec. 1st, 61.3% (1494) were male and 38.7% (945) were female,[11] consistent with the global pattern of more male deaths, though testing shows an infection rate of roughly 50/50.[12] Of the 536 recent reported deaths, 335 were men and 201 women (62.5%/37.5%), with men’s mortality rate continuing more than 50% higher than that of women.[13] The global difference is likely due to a combination of biological and behavioral factors, with behaviors that lead men to be in worse health than women generally perhaps more influential.[14]A report in Nature on August 26, 2020, found that older men produce a weaker immune response to the virus than older women. The proportion of reported Covid deaths to men in this region has increased over the months. But people of all genders/sexes with such co-morbidities as obesity, diabetes, heart disease, and respiratory ailments are at greater risk than those without. Of the deaths documented in the City of Houston between Oct. 2 and Dec. 1, only 5.5% (16/288) were listed as not involving an underlying condition.[15] Recent research suggests that mild overweight can also be a risk factor.[16]
Interestingly, the gender difference varies between the two local health departments, though less now than previously. The City of Houston Health Department’s reported 1438 deaths as of December 1 were 930 male / 508 female—64.7.0%m/35.3.0%f. But Harris County Health Department’s reported 1001deaths in the unincorporated sectors of Harris County as of Dec. 1 were 586 male, 415 female—58.5%m/41.5%f. That gender variation in mortality across jurisdictions may be linked to who is present in frontline jobs, the ages of the population present by race, and/or to other factors.
Figures 9 & 10 break down Covid-19 deaths by Gender, Race and Age in each health jurisdiction.
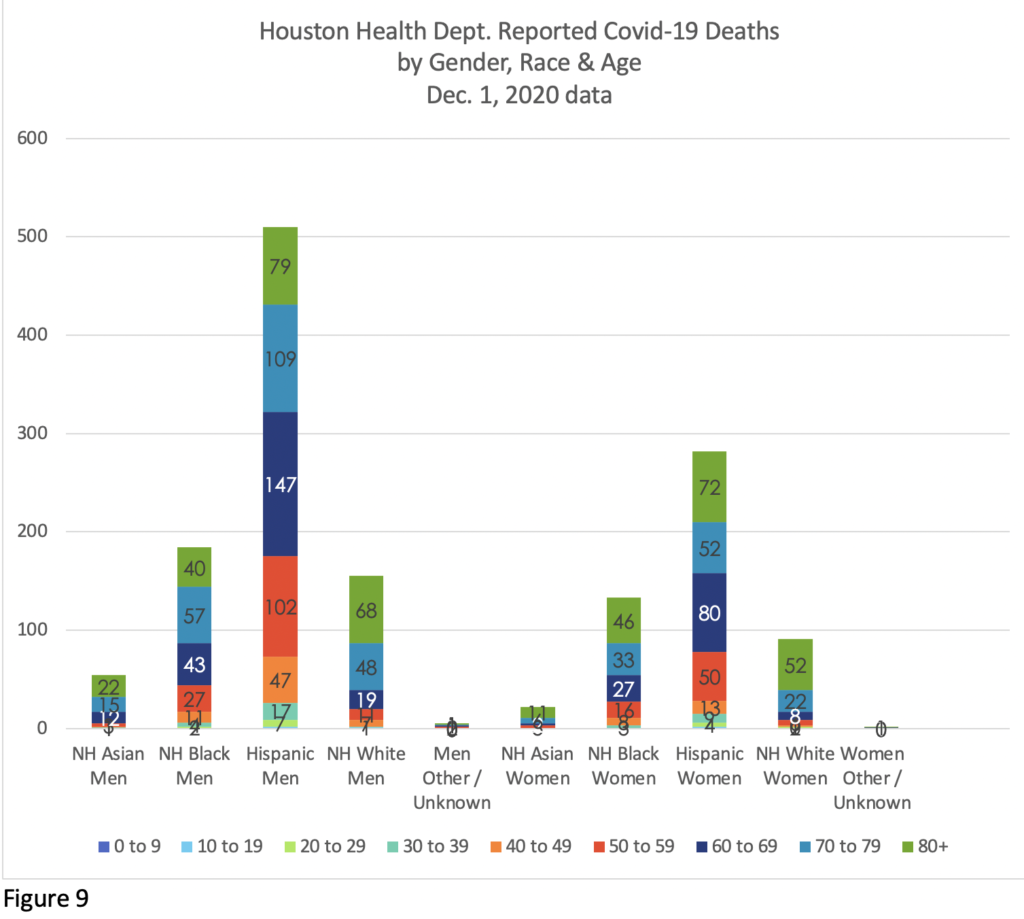
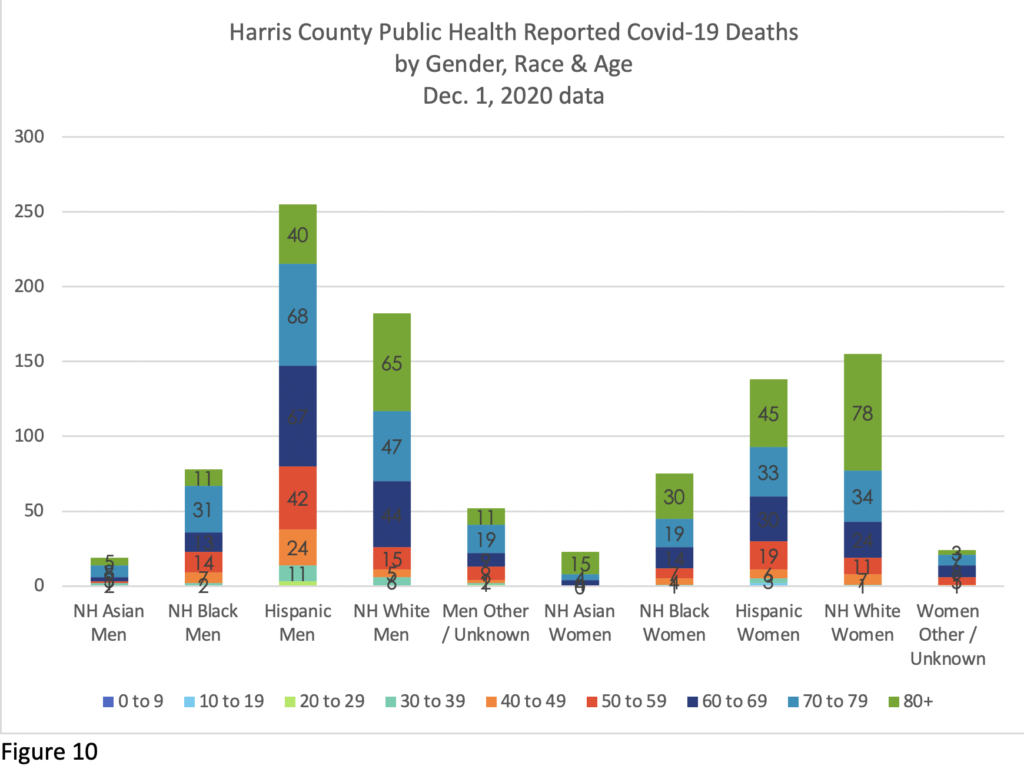
The racial and gender balance differs markedly in the two jurisdictions, linked to who is present, at what age, and in what work situations.
Overall the gender mortality gap in the region has been increasing, as shown in Figures 11, 12 and, 13, which document the Gender difference in Covid-19 deaths in the region. Figure 11 gives the overall picture, and Figures 12 and 13 break that down by Health Department.
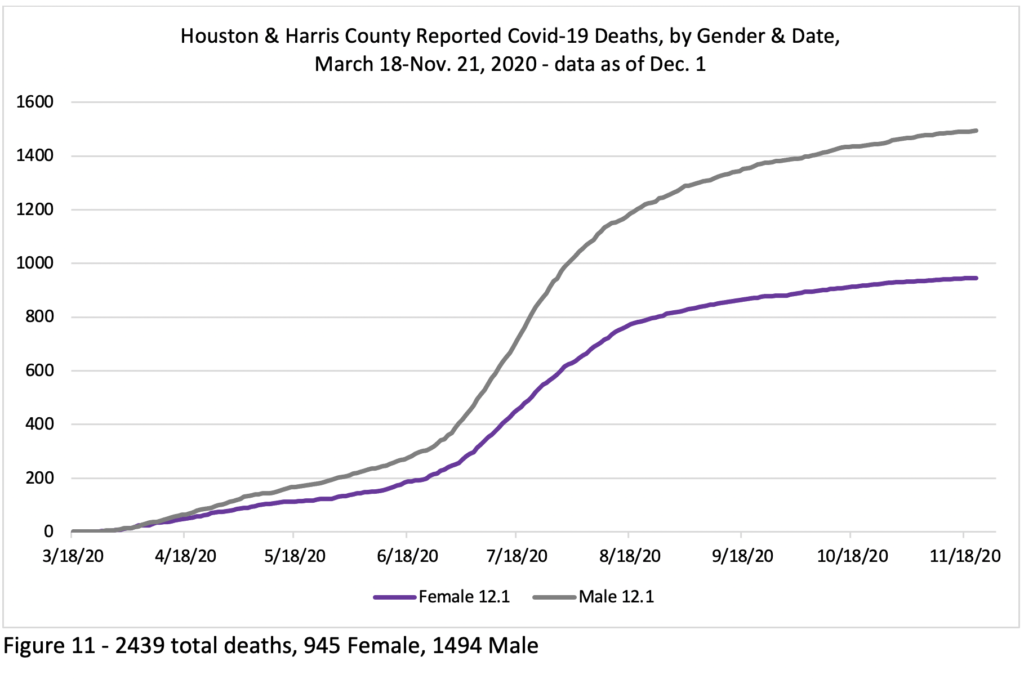
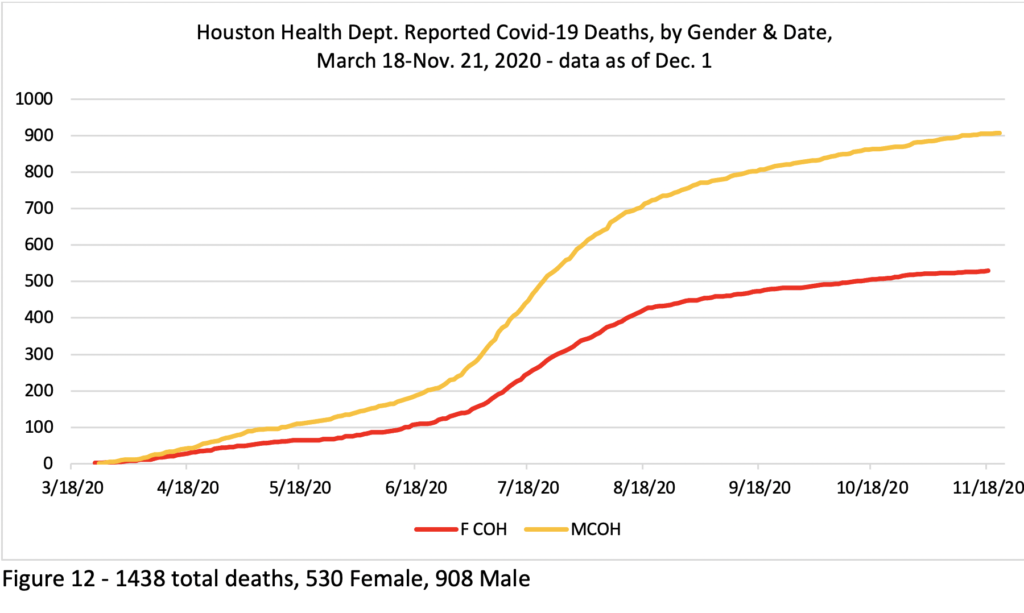
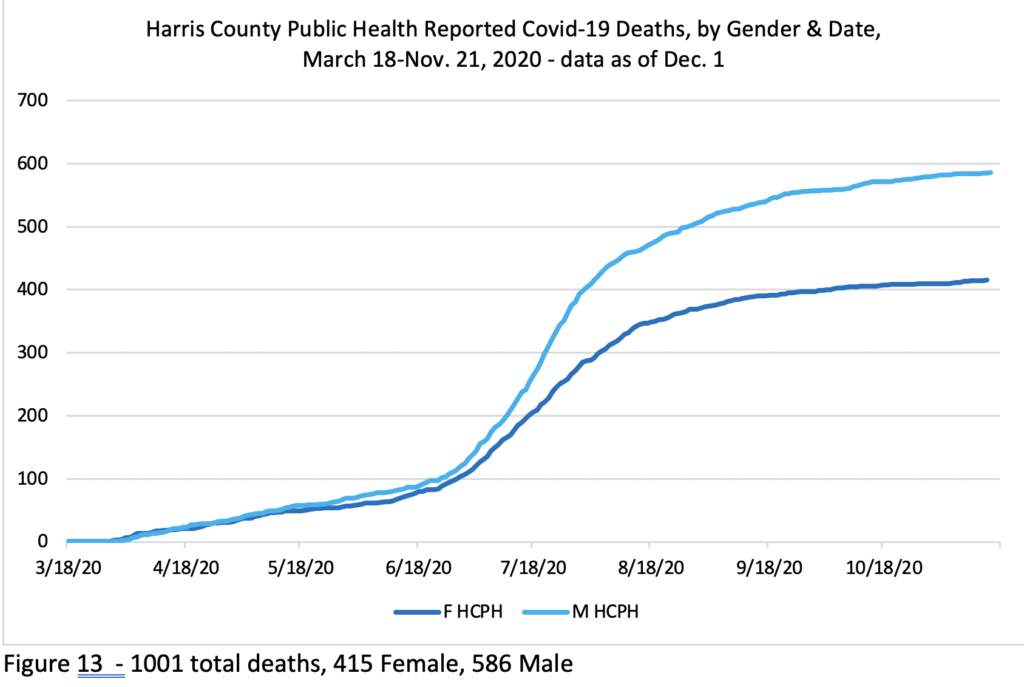
Figure 12 shows that the City of Houston had a big gap between male and female deaths early on, while the Harris County Health data in Figure 13 shows that deaths in the areas outside of the City of Houston in Harris County have not shown much of a gap until more recently.
AGE ANALYSES
Age also significantly intersects Covid-19 deaths. The majority of Covid-19 deaths globally occur among people over seventy, and that is the case here as well (deaths to people over 70 made up 1308 out of 2439 in Figure 14). Overall, the old, those with underlying conditions and the poor/socially vulnerable, or those with some combination of those factors, have proven most at risk. However, as noted above, the numbers of deaths here among people in their 40s, 50s and 60s are significant.
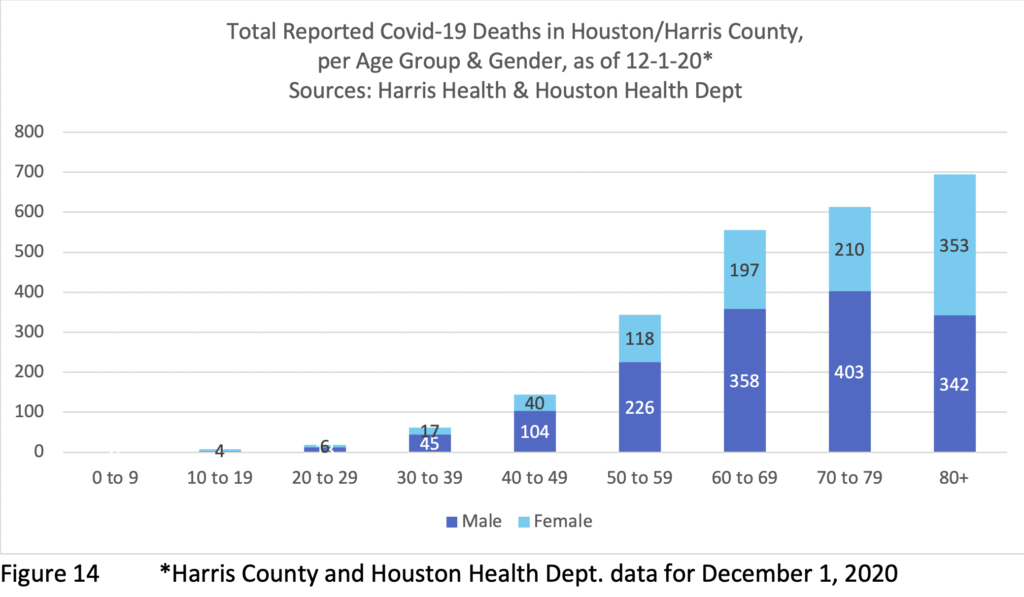
While women have died in lower numbers than men in all age bands between 20s and 70s, the dynamic changes in the 80+ band (353 women / 342 men), in large part because men represent only 37% of the population of people 80 and over in Harris County. Given that more than twice as many women as men survive into their 80s and beyond (due to men’s overall worse health outcomes), older women’s Covid-19 fatalities actually have occurred at much lower rate than their representation in the population of those 80+ compared to men (see Figure 7 for mortality rates by decade and gender). The same resiliency that allows women to live longer in general plays in with Covid-19. Nonetheless, Covid-19 has decimated the community of elders across the United States – and even more so in the Hispanic and Black communities, which already had low survival rates into their later decades due to lower health care access, etc. The nation is much the poorer for these losses.
Age intersects with gender and race/ethnicity outcomes across age ranges. Twenty of the 26 reported deaths to date among people between 10 and 29 (none reported here yet to children 9 or under) have occurred among Hispanics: 2 teen boys and 10 men in their 20s; 4 teen girls and 4 women in their 20s; along with 1 White teen boy and 2 Black men, 2 White women and one man of unknown race in their 20s. The 62 deaths reported among people in their 30s here to date break down as: 40 Hispanic, 10 Black, 8 White, 3 Asian, 1 Unknown Race; of them, 45 were male and 17 female. See above for discussion of deaths among men and women 59 and under. Deaths among the young are few across the board, and we will see ongoingly whether recent reports of higher transmission rates among younger people lead to an increased death rate in that group, or not. New effective treatments for critically ill patients may also reduce the overall death rate as we move toward distribution of the vaccine and the hoped-for end of widespread hospitalizations.
While susceptibility to Covid-19 is greater among the elderly, the numbers of deaths in each age/race-ethnicity group will also relate to which racial/ethnic groups include more elderly people. A UT Southwestern Medical Center study, summarizes Texas average life expectancies across gender and racial groups:
- Hispanic women – 83.9 years; Hispanic men – 78.28
- White women – 80.6; White men – 75.6
- Black women – 78.0; Black men – 72.4
Lower life expectancies are directly linked to poverty and can be tracked to zip code level via the UTS website.[17] The “Hispanic Health Paradox,” that Hispanics have longer lives in spite of high poverty rates, seems linked to high rates of immigration – and healthier food access / eating patterns in youth (and thus lower blood pressure and obesity), lower smoking rates and a tendency of healthier people to migrate. US-born Hispanics have similar obesity and other lifetime health issues linked to eating patterns as other Americans, in various class positions.[18]
Covid-19 has highlighted pre-existent disparities in American society linked to poverty and to the stresses of poverty and of racism, including health differences, and it has also emphasized gendered health differences—which may be in part biological and/or linked to socialized gender behaviors. Just as workplace exposure may be an issue for younger people, place and context of residence may also be a factor in whether a person contracts Covid-19: the virus has spread quickly in some nursing homes, for example (44% of Texas’s Covid-19 deaths up to late June occurred in such places),[19] while elders in multi-generational families may also be at risk if younger frontline workers bring contagion home. Nursing home infection rates ballooned in July.[20]
While Covid-19 has demonstrated some predictable socio-economic patterns, it also seems to behave in distinctive ways as a disease, around factors like gender, age, and post-infection immunity. We are watching an evolving disease, with evolving effects on various sectors.[21]
EXCESS DEATHS (Unreported COVID-19 Deaths)
The number of reported deaths does not accurately reflect total local deaths to Covid-19, for another reason as well: undiagnosed deaths. For an extended period of weeks this spring, few people were being tested and therefore quite a few who had the virus were not identified as Covid-19 deaths. This is a national issue, and a July study in JAMApresented the numbers of “excess deaths” due to respiratory ailments in March-May 2020 compared to a running average of the past five years for that period in each state.[22]They found that in Texas 55% of such excess deaths were not attributed to Covid-19 in March-May though most of them were caused by it, meaning that more than double the number of reported Covid-19 deaths were likely. Since May, deaths in hospital will be tested for Covid-19, but deaths at home will not necessarily be, so they may not be so registered if not tested previously. The percentage missed might change over time as testing increases, but some misses remain predictable, especially since, although testing has increased, it is not available timely to meet the demand of all who seek it during spikes.
The undiagnosed death rate is also increased when Texans without health insurance choose not to not seek help if they become ill until it’s too late, if at all. In 2018, Texas had the highest percentage of uninsured of any state at 17.7%, per the US Census bureau (national average was 8.9%).[23]That percentage has risen substantially since March 2020, because many of those who lost their jobs in the pandemic also lost their insurance through their employers. All the factors intertwine.
The undercount of infections and deaths and the actual rate of deaths also increase when people who wish to avoid challenge on their immigration status are slow to seek assistance, avoiding testing and/or hospitals. In addition, deaths due to other causes may be linked to Covid-19 if people with, for example, heart ailments refrain from getting treatment for fear of the virus.
ADDITIONAL PANDEMIC GENDER EFFECTS – Homeschooling, Domestic Violence, etc.
As noted in previous Snapshots, the lower level of female Covid-19 deaths contrasts to a number of other gender differentials around the virus, both national and local. These include:
• Women’s higher rates of workplace exposure in some frontline jobs (in Harris County, women make up 74% of health workers, 59% of fast food workers, 73% of pharmacists, and 69% of cashiers), which connects to women’s lower levels of pay (see UH IRWGS Initial Report on H/HC Gender & Sexuality Data, 2020);
• Women’s expanded responsibilities for childcare & homeschooling with school shutdowns (see below);
• Higher levels of domestic violence—though data specific to Harris County is still incoming, rates of calls to shelters have risen and global reports document a rise due to increased numbers locked in with their abusers, greater economic stress, children at home 24/7, and fear of potential Covid-19 in a shelter.
• & Efforts to reduce access to birth control and abortion during the pandemic, which may also affect women’s and families’ long-term status.
Researchers on workplace equity predict that women overall and single mothers in particular[24] will see long-term career setbacks if they have to step away from jobs due to their greater responsibility for childcare and homeschooling due to pandemic school closures.[25] To address this likelihood, with leadership on the working parent front, countermeasures could be adopted to guarantee that women will not see workplace penalties. Some parenting pay on the model of Germany’s Spring 2020 Covid salary-replacement program, for the service of raising the next generation in a time of crisis, would also be considered (see Gregory, What This County Needs Is a Working Parents Administration).
In September 2020, 865,000 women stepped out of jobs nationally, four times as many as men–apparently liked to the impossibility for many of managing both childcare/homeschooling and a job. A national discussion of the Fall 2020 homeschooling catastrophe is needed, followed by immediate action to address it. See also, Death and Childcare.
On the many concatenating Covid-intensified fronts documented in this Snapshot, both equity and economic stability demand thoughtful innovation and transformative action by business and civic leaders, both nationally and locally.
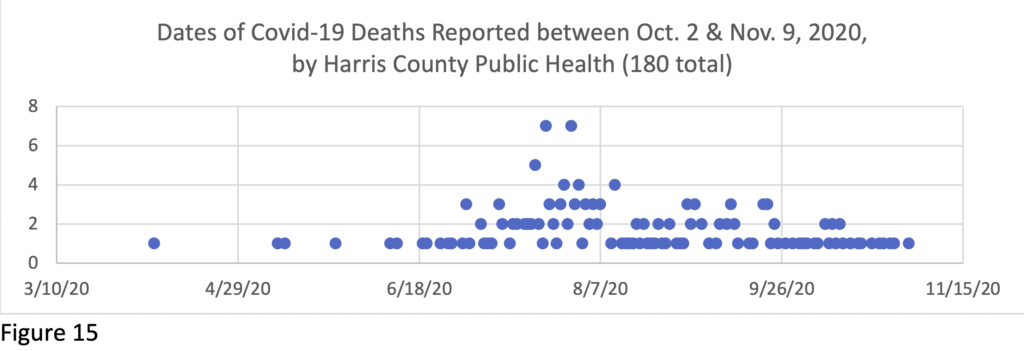
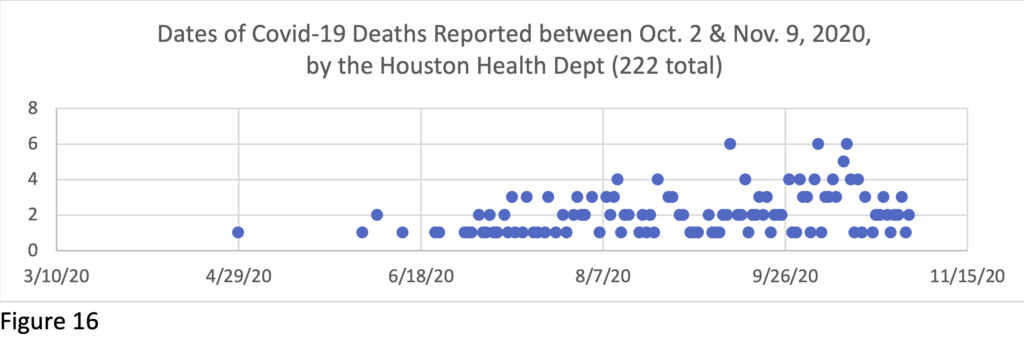
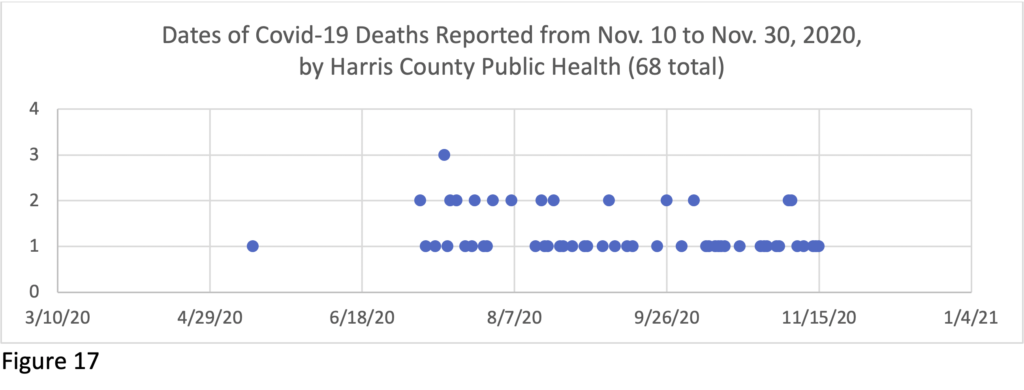
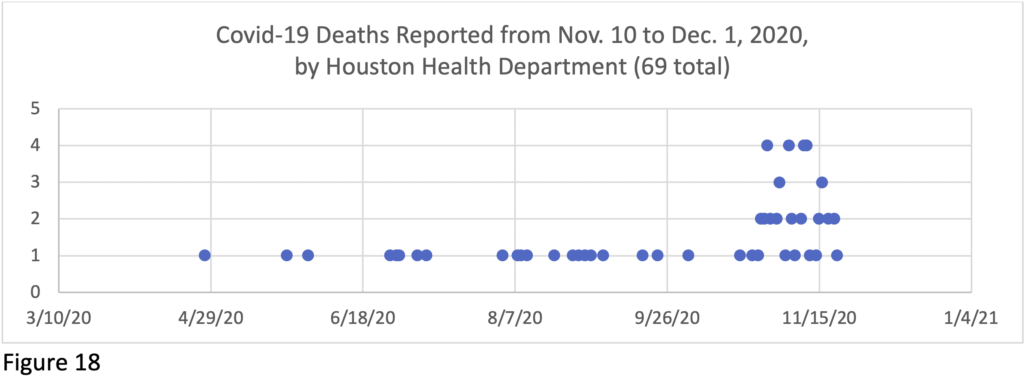
APPENDIX
Here follow charts tracking the lag in recent reporting of death certificates over months by the Houston and Harris County health departments. These charts do not include the many deaths that had been reported earlier, but they give a sense of the patterns of substantial delay.