Sorry I’ve been slow in posting here lately – there’s so much to say, I’m flummoxed on where to start!
For today, I’ll back up a bit, and point toward prognostications issued in August about the falling birth rate in 2008 and 2009. The National Center for Health Statistics tells us (here), in preliminary stats, that the rate fell from 69.2 births per 1000 fertile women* in 2007 to a mere 68.4 in 2008. That’s a little lower than the 68.7 that held in 2006, which was a big 2% jump from the year before. The New York Times reports that preliminary statistics for the early part of 2009 document a continuing downward trend.
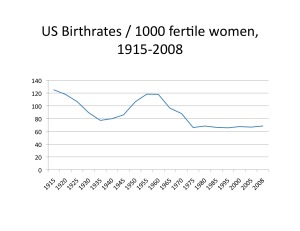
The ups and downs in the birth rate can be a bit confusing out of context — is .8% a lot or a little? So here’s a chart of the US rates over the past century, based on CDC data (for some reason I couldn’t make it show the 1910 data, which is 1.8 points higher [126.8] than that in 1915). 1910 is as far back as they go.

As you can see, the ups and down since 1975 have been minimal compared to the swings experienced across the preceding six decades (due to things like world wars, the Depression, the baby boom, and the arrival of hormonal birth control in 1960).
The Times story links the decline in both years to the recession — not surprising given the effect of past recessions seen above.
Will women who’ve waited for babies for career reasons now also delay further for the recession, given the dicey fertility context?
And to what degree is the decline in the birth rate in 2008 (pretty early days for the recession) reflective of a decrease in births to teens, due to states’ turning away from abstinence-only education, with its attendant rise in rates for teens in 2007?
Hang on for the official 2008 birth stats from the CDC toward year’s end. Another nail biter!
How does the baby wave look in your house and neighborhood?
And in case you didn’t see it yesterday, here’s Judith Warner’s recent blog on how it’s time for the Times and other media to stop misrepresenting women’s “choices” around work and family — because that has distorting effects on public policy. You really think so?
*”Fertile women” are officially defined as the number of women in the population 15-44 years old, but the births included in calculating the rate also include all births to anyone who happens to have one before or after that age range.

