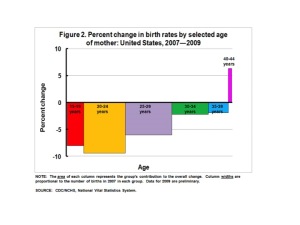
Data can always be variously interpreted. This chart was published as part of a report called ” Recent Decline in Births in the United States, 2007-2009.” And clearly the overall rate is down, as are the specific rates in most categories. But not all.* Births to women 40-44 were up 6% overall in the past two years (3% per year).
The decline is generally tied to the recession — though this report does not discuss cause.
The suspenseful part for demographers: What will follow? When/if there’s an economic upswing, will births resurge, and will the effect ripple upward across age brackets (will women who would have liked a first, second or third child during the recession but refrained from childbearing in, say, the 35-39 age band go on to have that child in the 40-44 age band, or similarly will those who delayed at 30-34 pay it forward in the 35-39 band, and so on)?
Women who are currently in the 40-44 age band obviously are not delaying. In fact, they may be previewing the answer to the prior question –since the recession is already several years old, and a good proportion of those in the 40-44 band may well be women who were open to delaying in their 30s, but not in their 40s (a point when women often feel pressure to act fast). If the recession ends and a resurgence in births follows, it will combine the demand of people who didn’t want a child prior but now do and feel free to act on that wish, with the pent up demand of women who delayed.
Births to women 45-54, almost entirely due to donor eggs, were up 17% in the period. These are not on the chart, presumably because they were so few relatively speaking (7,934 in 2009, up from 3,722 in 1999). This is also an age band with potential for dramatic increase, though the actuality is entirely unpredictable.
Here’s the link to the full report.
*The same trends are noted in 2010 birth data through June, but it is not broken down by age of mother.

