[An earlier version of this post called the 2010 fertility an all-time low, based on figures originally published in the annual CDC reports. Revised figures published in 2003 (NVSR 54, no.2, p. 29) suggest that there’s still a way to go before the fertility rate reaches the updated all-time low, which was 63.6 in 1997. This post has been altered to reflect the updated figures.]
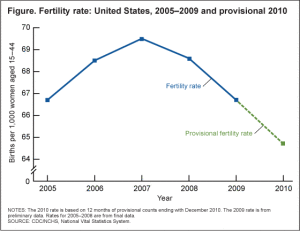
This week the CDC issued a provisional overview of birth data for 2010 – providing a chart indicating the continuing decline, apparently linked to the continuing current recession, as well as the earlier rise linked to the false sense of economic well being that preceded that recession, since 2005:

CDC chart based on 2005-2009 birth data and 2010 provisional data
The report was short, since it is provisional, including no details about the ages of the women involved in these births. The full preliminary report, with more details, will not be out for months. Final reports generally come out about a year after the preliminary data.
If the full reports confirm the provisional data, the 2010 US fertility rate (64.7 births per thousand women in the 15-44 age band) will have fallen below the recent low of 64.8 hit in 2002 – when we were also in recession. The years 1995-1999, characterized by economic boom, also had fertility rates under 64.7 (64.6, 64.1, 63.6, 64.3, 64.4, respectively).
You may recall that last year we had stories telling us that the BIRTH rate had fallen to an all time low – and I wrote a piece all about how the birth rate was not telling us that women were having kids at an all-time low level — it’s the fertility rate that tells us that. Instead the birth rate was going down in part because it tells you how many births there were per people in the whole population, and since people are living longer, and those old folks don’t have babies (or very few), there were fewer births per thousand.
The fertility rate was going down too in 2009 however – just not to record lows. And it’s still declining.
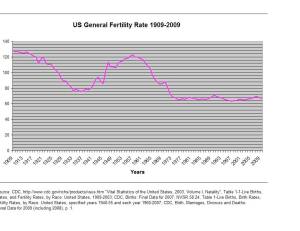
For a wider perspective, here’s a chart of the fertility rate from 1909-2009 – and you can add on the 2010 decline in your mind’s eye. (The Y [vertical] axis goes by 20s from 0 to 140.)

Births/thousand US women 15-44, 1909-2009

